Sync Observability Settings
8 minute read
This guide explains the settings to configure how RudderStack retains sync logs and snapshot tables for your Reverse ETL connection, whether it retries failed records in later syncs, and how to see every record that failed in a sync and why.
Sync settings
Access these settings in the Settings tab of your Reverse ETL connection:
| Setting | Description | ||||||
|---|---|---|---|---|---|---|---|
| Retain sync logs | This setting is toggled on by default and instructs RudderStack to store the sync logs in your warehouse. You can also configure the below settings:
| ||||||
| Retry failed records | This setting is toggled on by default and causes RudderStack to continually retry sending the failed records. | ||||||
| Retain and show failures | This setting is toggled off by default. Turn it on to have RudderStack write the error recorded for every failed record to a failed records table in your warehouse and show it in the sync’s failed records view. It applies from the next sync and can take up to a minute to reach your data plane.
|
Storing sync logs, snapshot tables, and failed records may incur additional warehouse costs.
Sync logs
RudderStack supports storing Reverse ETL sync logs in your warehouse. These logs are stored in a certain format in the RudderStack schema (used for storing the state of each sync). You can explore these logs using SQL or any BI tool to debug any issues or failures during syncs.
Storing the sync logs in your warehouse incurs additional costs.
Sync log table schema
The sync log table schema is as follows:
| Column | Description |
|---|---|
connection_id | Connection ID for the sync run. |
sync_run_id | Unique identifier for the sync run. |
primary_key | Value of the primary key column selected for the sync. |
operation | Nature of the operation performed on the row. It can be either insert, update, or delete. |
status | Result of the operation. It can be either succeeded or failed. |
error_reason | Reason for failure in case status is failed. |
sync_started_at | Sync start time in UTC. |
sync_finished_at | Sync finish time in UTC. |
Aborted syncs
When you stop a running sync, the sync stops and is treated as unsuccessful. In the dashboard, this appears as Aborted. In the sync log table, records from that run that did not succeed show status as failed.
The aborted sync does not resume — the next sync starts as a new run rather than picking up where the aborted one left off. Any records that did not sync successfully are handled in subsequent syncs according to your retry settings.
This differs from syncs interrupted by a system shutdown, for example during a deployment. In that case, the sync is paused safely and resumes from where it stopped once the system is back up.
Snapshot table schema
RudderStack generates a snapshot table in the RudderStack schema for each sync. It contains rows (barring invalid rows like duplicate primary keys and null primary keys) from the data source like a warehouse table, view, SQL model, or audience. It also includes the details of the changes that happened in each row during the sync.
Storing the snapshot tables in your warehouse will incur additional costs.
The snapshot tables are stored in the snapshot_<connection_id>_<sync_run_id> format, where:
<connection_id>is the Reverse ETL connection ID.<sync_run_id>is the unique identifier for the sync run.
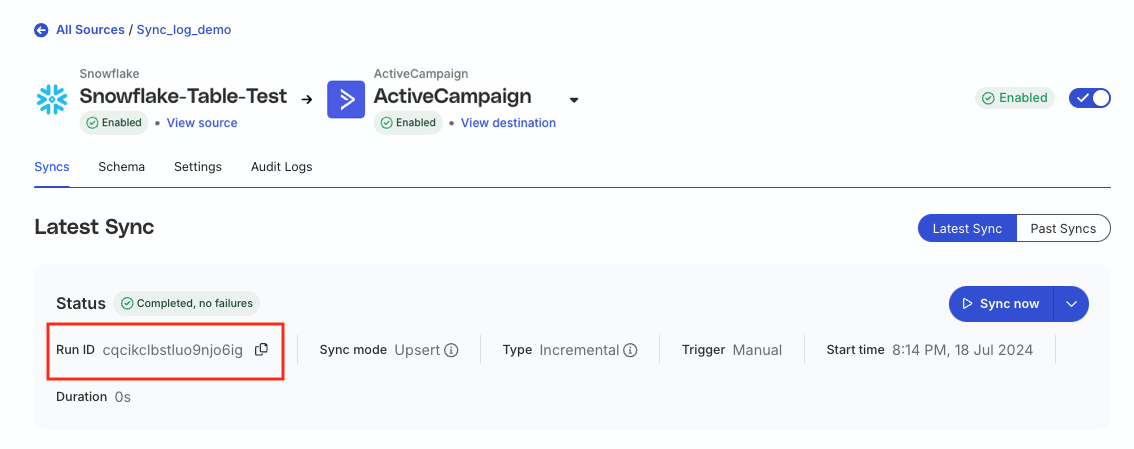
The snapshot table schema is as follows:
| Column | Description |
|---|---|
rudder_operation_type | Type of operation performed on the row when compared with the last synced data. It can be either insert, update, or delete. |
<column_name> | Name of the columns selected in the mappings for the sync. |
Debug issues with sync logs
This section lists some queries you can run on your sync logs for debugging issues in your Reverse ETL syncs.
- Check how a particular primary key has changed over time for a Reverse ETL connection:
select * from _rudderstack.sync_log where primary_key='<primary_key>' and connection_id='<connection_id>';- Check the data for failures in the sync run:
SELECT *
FROM   _rudderstack.sync_log sl
       LEFT JOIN
       _rudderstack.snapshot_<connection_id>_<sync_run_id>
       sn
              ON sl.primary_key = sn.<primary_key>
WHERE  sl.sync_run_id = '<sync_run_id>'
       AND sl.status = 'failed';
Make sure to replace the placeholders in the above queries with the actual values.
Retry failed records
The Retry failed records toggle in the sync settings lets you determine whether RudderStack should continually retry sending the failed records in the previous syncs to the downstream destination.
If a failed record has undergone any changes, RudderStack retries syncing the updated record instead.
Failed records
When a sync completes with failures, the Syncs tab shows a Failed records panel for that run. The panel is available for warehouse-backed Reverse ETL connections and for audience syncs. It isn’t available for file-based sources.
The panel has two layers:
- Error breakdown: How many records failed with each error code. RudderStack always shows these counts and they never expire.
- Failed records list: Every failed record with its identifier, operation, error code, and the exact error message RudderStack recorded, with a drill-in to the record’s source row. This layer needs the Retain and show failures setting.
Enable per-record error details
Turn on Retain and show failures in the connection’s Settings tab, or click Enable error details in the panel. RudderStack asks you to confirm before enabling it, because the error a destination returns can echo values from the record.
The setting applies from the next sync. It can take up to a minute to reach your data plane, so wait a moment after saving before you start one. Records from syncs that ran before you enabled it aren’t captured, so those runs show counts only.
You can’t change the setting while a sync is running.
Failure retention controls how many days RudderStack keeps each sync’s failed records in your warehouse. The default is 30 days and the minimum is 7. Runs older than the retention window show counts only.
Error breakdown
The panel shows a card for each of the four most common error codes in the run. Each card shows:
- The code, labelled
HTTP <status>when the destination returned it, orCode 410when RudderStack stopped retrying the record. - The exact number of records that failed with it.
- Where the code came from: Destination response or RudderStack abort.
- The code’s share of all the failures the destination reported, as a percentage and a bar. Hover over the percentage to see the total it is measured against.
Any further codes are available in the code filter.
Important considerations
- Records that failed before they reached the destination have no error code — they don’t appear on a card. Filter the list by No code to see them so the cards can add up to less than the run’s total failures.
- Counts come from RudderStack’s reporting store and can lag the sync by a couple of minutes.
Failed records list
Below the breakdown, the list shows one row per failed record:
| Column | Description |
|---|---|
| Identifier (primary key) | Value of the primary key column selected for the sync. |
| Operation | The operation RudderStack attempted: insert, update, or delete. |
| Code | The error code, or — if the record has none. |
| Error message (as recorded) | The exact error RudderStack recorded for the record. |
Search by primary key or filter by code. Click View on a row to open the record. The Error recorded card shows the full error, and the Source row card shows the record’s values, read live from your warehouse.
The Error recorded card names where the code came from: Destination response · HTTP <status> when the destination replied, RudderStack abort · code 410 when RudderStack stopped retrying the record, and Pre-delivery failure when the record never reached the destination.
What the error contains depends on where the record failed:
- If the destination replied, it’s the destination’s response, exactly as returned. Very long responses are truncated.
- If RudderStack gave up on the record, it’s RudderStack’s own reason, such as
retry limit reached. - If the record never reached the destination, there may be no error text.
The list shows up to the first 5,000 records of a run. The complete set for every run is in theREJ_*table in your warehouse — see Failed records table.
If Retry failed records is on, RudderStack retries these records in later syncs. Each run’s panel shows the failures from that run only.
Required permissions
- Everyone in the workspace can see the error breakdown.
- The failed records list and the record drill-in show record identifiers, error messages, and source rows, which can contain personal data. Admins can view them; members need the rETL Data Access PII permission for the source.
Why a run shows counts only
| Message | Reason |
|---|---|
| Per-record error details aren’t enabled for this connection | Retain and show failures is off. Turn it on to capture details from the next sync. |
| Per-record details aren’t available for this run | The run is older than the failure retention window, or it ran before the setting was enabled. |
| Per-record details weren’t captured for this run | The run started before the setting took effect. If it started after you enabled the setting, contact support. |
| Warehouse settings changed after this run | The connection’s warehouse account or schema changed after this run, so its records can no longer be located. Runs since the change are unaffected. |
